The Company’s shares were listed on the Parallel Market of the Athens Stock Exchange on 10 April 1998 under the symbol “KYRI”. Pursuant to the new Athens Exchange Rulebook which has been in force since 28 November 2005 the shares are traded on the Securities Market in the category “Medium and Small Capitalization” under the same symbol “KYRI”. The Company’s share participate in the composition of FTSE/Athex Small Cap 80 Index since the session of 02/06/2008.
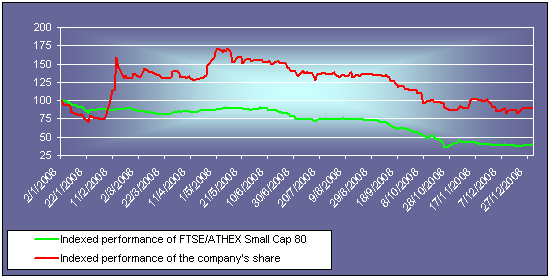
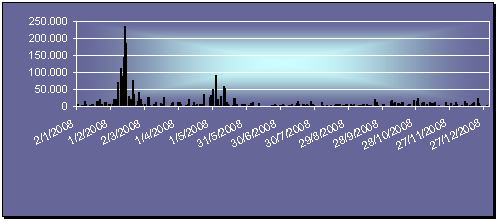
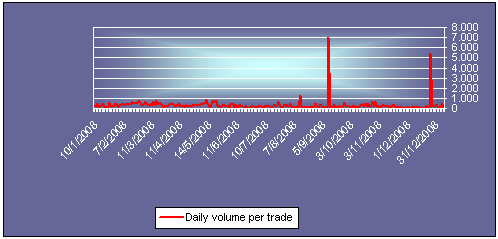
The figures below show the indexed performance of the company’s share and that of FTSE/ATHEX Small Cap 80, the daily trading volume as well as the daily volume per trade of the company’s shares for the period January – December 2008. The following table shows the monthly prices, the monthly and average daily trading volume and the monthly marketability of company’s shares for the same period. It should be noted that monthly price is defined as the closing price on the last trading session of each month and monthly trading volume and monthly marketability as the sum of the daily trading volumes and the daily marketability respectively of each month.
INDEXED PERFORMANCE OF COMPANY’S SHARE AND FTSE/ATHEX SMALL CAP 80
PERIOD JANUARY – DECEMBER 2008
DAILY TRADING VOLUME OF THE COMPANY’S SHARE
PERIOD JANUARY – DECEMBER 2008
DAILY VOLUME PER TRADE OF THE COMPANY’S SHARE
PERIOD JANUARY – DECEMBER 2008
PRICES – TRADING VOLUME – MARKETABILITY OF SHARE
| Months | Monthly Share Market Price | % | Monthly Trading Volume of Share | % | Average Daily Trading Volume of Share | % | Monthly Marketability of Share | % |
| Jan.* | 1.09 | -24.8% | 118,694 | 86.0% | 5,361 | 59.6% | 0.78% | 86.0% |
| Feb. | 1.92 | 76.1% | 1,148,874 | 867.9% | 57,708 | 920.5% | 7.56% | 867.9% |
| Mar. | 1.99 | 3.6% | 124,302 | -89.2% | 8,287 | -84.9% | 0.82 | -89.2% |
| Apr. | 2.38 | 19.6% | 200,743 | 61.5% | 10,037 | 21.1% | 1.32% | 61.5% |
| May. | 2.21 | -7.1% | 370,111 | 84.4% | 17,624 | 75.6% | 2.44% | 84.4% |
| Jun. | 2.00 | -9.5% | 57,671 | -84.4% | 2,884 | -83.6% | 0.38% | -84.4% |
| Jul. | 1.98 | -1.0% | 98,315 | 70.5% | 4,275 | 48.2% | 0.65% | 70.5% |
| Aug. | 1.94 | -2.0% | 49,331 | -49.8% | 2,467 | -42.3% | 0.32% | -49.8% |
| Sep. | 1.63 | -16.0% | 100,903 | 104.5% | 4,587 | 85.9% | 0.66% | 104.5% |
| Oct. | 1.24 | -23.9% | 177,685 | 76.1% | 8,077 | 76.1% | 1.17% | 76.1% |
| Nov. | 1.37 | 8.7% | 89,179 | -49.8% | 4,459 | -44.8% | 0.59% | -49.8% |
| Dec. | 1.27 | -7.3% | 114,604 | 28.5% | 5,457 | 22.4% | 0.75% | 28.5% |
* The percentage changes of January are taking into account the like values of December of the previous year
The table below present statistical data concerning the closing prices of the Company’s shares.
SHARE DATA *
PERIOD 02 JANUARY – 31 DECEMBER 2008
| Average Closing Market Price (€) | 1.74 |
| Highest Closing Market Price (€) | 2.44 |
| Lowest Closing Market Price (€) | 1.00 |
| Average Monthly Trading Volume (number of shares) | 220,868 |
| Average Monthly Marketability | 1.45% |
| Annual Marketability | 17.45% |
| Dividend / Share from Profits of Fiscal Year 2007 (€) | 0.035 |
| Capitalization at the end of the period (€) | 19,291,706 |
*Adjusted to all corporate actions
The following chart presents the monthly changes in the closing prices of the company’s share in relation with the monthly changes of the values of the Index FTSE/ATHEX Small Cap 80.
MONTHLY DIFFERENCE IN SHARE MARKET PRICE AND IN INDEX FTSE/ATHEX SMALL CAP 80
PERIOD JANUARY – DECEMBER 2008
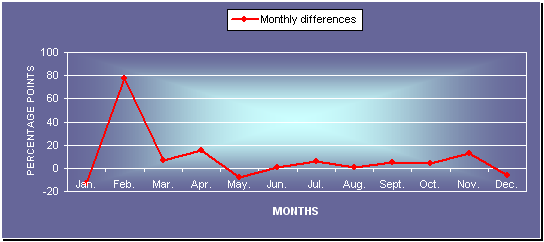
MONTH CHANGE IN SHARE MARKET PRICE
AND INDEX FTSE/ATHEX SMALL CAP 80
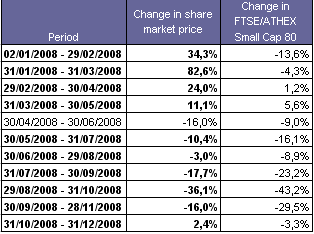
THREE MONTH CHANGE IN SHARE MARKET PRICE
AND INDEX FTSE/ATHEX SMALL CAP 80
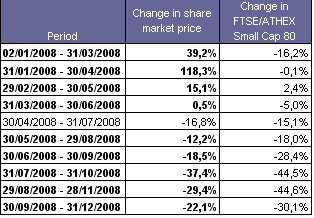
FOUR MONTH CHANGE IN SHARE MARKET PRICE
AND INDEX FTSE/ATHEX SMALL CAP 80
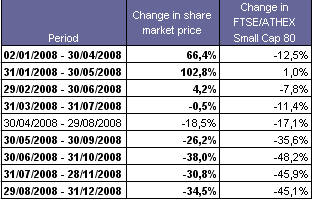
FIVE MONTH CHANGE IN SHARE MARKET PRICE
AND INDEX FTSE/ATHEX SMALL CAP 80
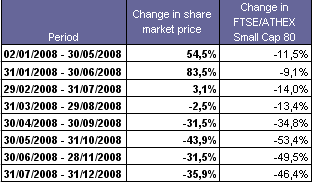
SIX MONTH CHANGE IN SHARE MARKET PRICE
AND INDEX FTSE/ATHEX SMALL CAP 80
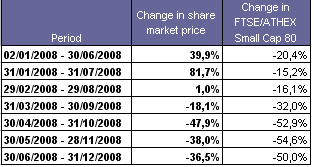
SEVEN MONTH CHANGE IN SHARE MARKET PRICE
AND INDEX FTSE/ATHEX SMALL CAP 80
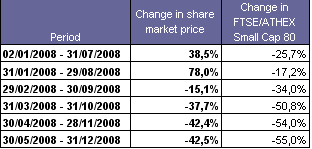
EIGHT MONTH CHANGE IN SHARE MARKET PRICE
AND INDEX FTSE/ATHEX SMALL CAP 80
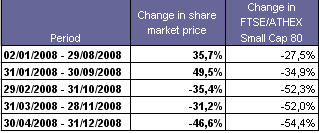
NINE MONTH CHANGE IN SHARE MARKET PRICE
AND INDEX FTSE/ATHEX SMALL CAP 80
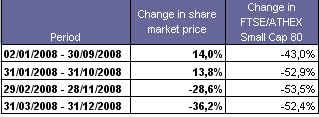
TEN MONTH CHANGE IN SHARE MARKET PRICE
AND INDEX FTSE/ATHEX SMALL CAP 80

ELEVEN MONTH CHANGE IN SHARE MARKET PRICE
AND INDEX FTSE/ATHEX SMALL CAP 80

TWELVE MONTH CHANGE IN SHARE MARKET PRICE
AND INDEX FTSE/ATHEX SMALL CAP 80

RANGE OF CLOSING SHARE MARKET PRICES
| Months | Low | High | Range |
| Jan. | 1.00 | 1.43 | 0.43 |
| Feb. | 1.07 | 2.28 | 1.21 |
| Mar. | 1.86 | 2.06 | 0.20 |
| Apr. | 1.82 | 2.38 | 0.56 |
| May. | 2.15 | 2.44 | 0.29 |
| Jun. | 2.00 | 2.23 | 0.23 |
| Jul. | 1.83 | 2.02 | 0.19 |
| Aug. | 1.88 | 1.98 | 0.10 |
| Sep. | 1.62 | 1.94 | 0.32 |
| Oct. | 1.24 | 1.65 | 0.41 |
| Nov. | 1.23 | 1.48 | 0.25 |
| Dec. | 1.17 | 1.30 | 0.13 |
TRANSACTION VALUE
| Months |
KIRI (in €) |
% | Shares of Index FTSE/X.A Small Cap 80 (in mil. €) | % |
| Jan.* |
134,365.52 |
45.42% |
271.35 |
18.43% |
| Feb. |
2,119,562.66 |
1477.46% |
139.97 |
-48.42% |
| Mar. |
236,629.57 |
-88.84% |
123.06 |
-12.08% |
| Apr. |
404,223.71 |
70.83% |
127.44 |
3.56% |
| May. |
877,763.01 |
117.15% |
133.72 |
4.93% |
| Jun. |
122,421.36 |
-86.05% |
120.40 |
-9.96% |
| Jul. |
189,037.32 |
54.42% |
74.57 |
-38.06% |
| Aug. |
94,971.80 |
-49.76% |
35.54 |
-52.34% |
| Sep. |
175,131.50 |
84.40% |
76.73 |
115.90% |
| Oct. |
239,909.34 |
36.99% |
93.54 |
21.91% |
| Nov. |
119,311.60 |
-50.27% |
35,22 |
-62.35% |
| Dec. |
158,949,46 |
33.22% |
47.61 |
35.18% |
* The percentage changes of January are taking into account the transaction values of the Company’s share as well as the shares that compose the Index FTSE/ X.A Small Cap 80 of December of the previous year.